Last official estimated population of Inala - Richlands (as Statistical Area Level 2) was 19 094 people (on 2017-06-30)[2]. This was 0.08% of total Australian population and 0.383% of QLD population. Area of Inala - Richlands is 10.90 km², in this year population density was 1 751.74 p/km² . If population growth rate would be same as in period 2016-2017 (+2.12%/yr), Inala - Richlands population in 2025 would be 22 589. [0]
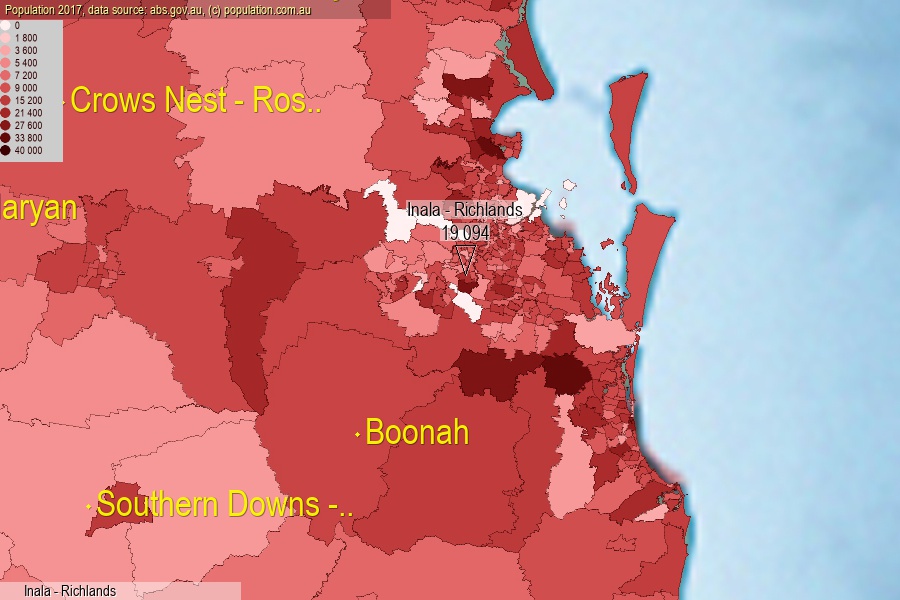
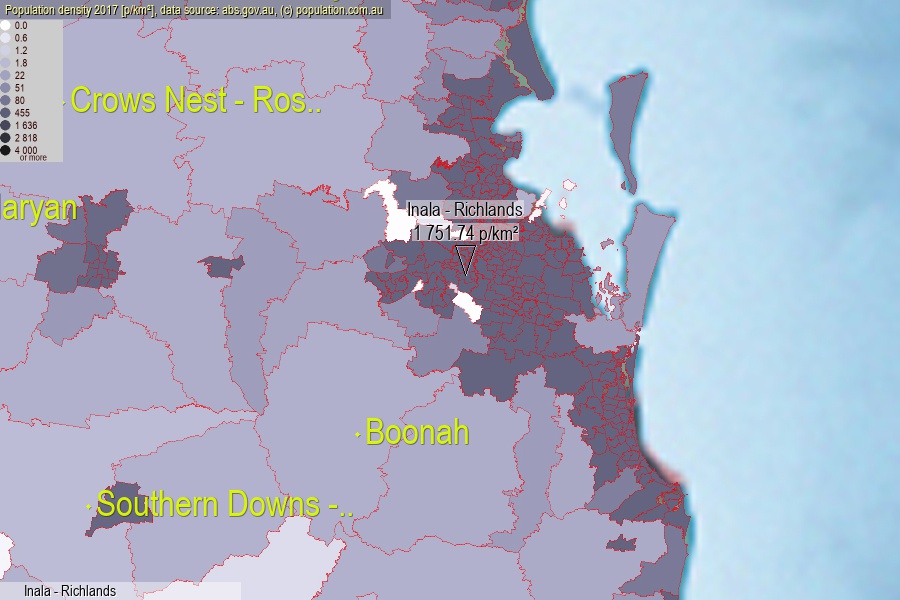
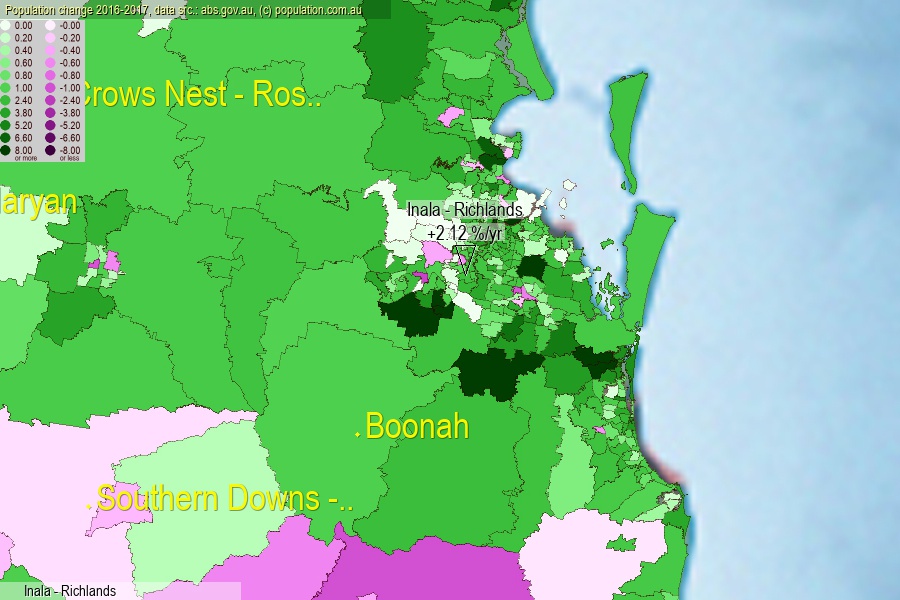
Click to enlarge. Inala - Richlands is located in the center of the images.
Population [people], population density [p./km²] and population change [%/year] [2]
View borders » (new window) [4]
[1991-1992] -2.01 %/Yr.
[1992-1993] -1.24 %/Yr.
[1993-1994] -2.49 %/Yr.
[1994-1995] -2.66 %/Yr.
[1995-1996] -1.69 %/Yr.
[1996-1997] -2.06 %/Yr.
[1997-1998] -1.89 %/Yr.
[1998-1999] -2.21 %/Yr.
[1999-2000] +0.22 %/Yr.
[2000-2001] -0.03 %/Yr.
[2001-2002] +1.61 %/Yr.
[2002-2003] +1.14 %/Yr.
[2003-2004] +0.84 %/Yr.
[2004-2005] +1.04 %/Yr.
[2005-2006] +1.92 %/Yr.
[2006-2007] +0.74 %/Yr.
[2007-2008] +2.07 %/Yr.
[2008-2009] +2.80 %/Yr.
[2009-2010] +2.73 %/Yr.
[2010-2011] +2.32 %/Yr.
[2011-2012] +3.46 %/Yr.
[2012-2013] +4.18 %/Yr.
[2013-2014] +1.87 %/Yr.
[2014-2015] +2.18 %/Yr.
[2015-2016] +4.41 %/Yr.
[2016-2017] +2.12 %/Yr.
[0] Calculated with linear interpolation from officially estimated population
[1] Read more about SA2 and Australian Statistical Geography Standard (ASGS) on abs.gov.au
[2] Population data from Australian Bureau of Statistics (Population and density: 2017; change: 2016-2017)
[3] Digital Boundaries: Australian Statistical Geography Standard (ASGS) 2016.
[4] Border coordinates are simplifyed using Ramer-Douglas-Peucker algorithm.